JMeter Tips & Tricks – Tip 10

Tip 10 – Installing Jmeter-Plugins from commandline

So, you’ve built a beautiful script, now you want to run it from one or more remote servers. These servers are setup, you downloaded the JMeter zit, unzipped it and all. Since you will be running off a server there is no big fat GUI to install the oh so needed JMeter Plugins though.

What do you do to make those work?

Thankfully since version 3.* this has become fairly easy. The JMeter Plugin Manager was introduced and with that comes the PluginsManagerCMD (be it the .bat or the .sh)

When running the PluginsManagerCMD however it is not very friendly in its messaging:

./PluginsManagerCMD.sh 
ERROR StatusLogger No log4j2 configuration file found. Using default configuration: logging only errors to the console. Set system property 'org.apache.logging.log4j.simplelog.StatusLogger.level' to TRACE to show Log4j2 internal initialization logging.
Options for tool 'PluginManagerCMD': <command> <paramstr> where <command> is one of: help, status, available, upgrades, install, install-all-except, uninstall.
ERROR: java.lang.IllegalArgumentException: Command parameter is missing
*** Problem's technical details go below ***
Home directory was detected as: /run/media/martijndevrieze/Data/Downloads/builds/jmeter-nightly/apache-jmeter-r1802079/lib
Exception in thread "main" java.lang.IllegalArgumentException: Command parameter is missing
   at org.jmeterplugins.repository.PluginManagerCMD.processParams(PluginManagerCMD.java:20)
   at kg.apc.cmdtools.PluginsCMD.processParams(PluginsCMD.java:66)
   at kg.apc.cmdtools.PluginsCMD.processParams(PluginsCMD.java:22)
   at sun.reflect.NativeMethodAccessorImpl.invoke0(Native Method)
   at sun.reflect.NativeMethodAccessorImpl.invoke(NativeMethodAccessorImpl.java:62)
   at sun.reflect.DelegatingMethodAccessorImpl.invoke(DelegatingMethodAccessorImpl.java:43)
   at java.lang.reflect.Method.invoke(Method.java:498)
   at kg.apc.cmd.UniversalRunner.main(UniversalRunner.java:105)

So, what exactly are you supposed to do with this script?

Somewhere in between the errors is a useage message:

Options for tool 'PluginManagerCMD': <command> <paramstr> where <command> is one of: help, status, available, upgrades, install, install-all-except, uninstall.

As it turns out, you can get this info with a bit less error information when running the simple command:

./PluginsManagerCMD.sh help

I started out with checking the status of the PluginsManager:

./PluginsManagerCMD.sh status
ERROR StatusLogger No log4j2 configuration file found. Using default configuration: logging only errors to the console. Set system property 'org.apache.logging.log4j.simplelog.StatusLogger.level' to TRACE to show Log4j2 internal initialization logging.
[jpgc-plugins-manager=0.12, jmeter-core=r1802079, jmeter-ftp=r1802079, jmeter-http=r1802079, jmeter-jdbc=r1802079, jmeter-jms=r1802079, jmeter-junit=r1802079, jmeter-java=r1802079, jmeter-ldap=r1802079, jmeter-mail=r1802079, jmeter-mongodb=r1802079, jmeter-native=r1802079, jmeter-tcp=r1802079, jmeter-components=r1802079]

We now have an overview of the plugins installed in JMeter, nothing out of the standard packaged set.

Now let’s install some plugins, for that the following command is needed:

./PluginsManagerCMD.sh install  <paramstr>

Where the <paramstr> needs to be filled with something sensible. This something sensible is the ID of the plugin you want to install.

You can find the ID’s on the Jmeter-Plugins site in the menu item “Browse plugins”. Look at the plugin(s) you need and grab the accompanying ID:

jmeterpluginID

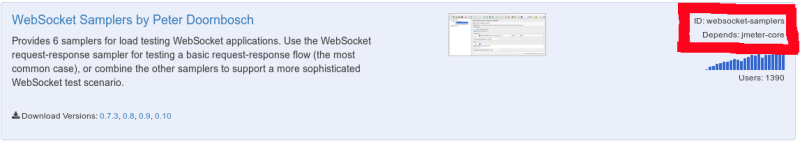
For the sake of this example the command will be:

./PluginsManagerCMD.sh install websocket-samplers

Unfortunately JMeter will not provide you any feedback while running this. The only easy way to verify that the plugin is there is by either running the script that needs this plugin, or checking your jmeter lib/ext directory:

ls ../lib/ext/
ApacheJMeter_components.jar ApacheJMeter_http.jar ApacheJMeter_junit.jar ApacheJMeter_native.jar readme.txt
ApacheJMeter_core.jar ApacheJMeter_java.jar ApacheJMeter_ldap.jar ApacheJMeter_tcp.jar
ApacheJMeter_ftp.jar ApacheJMeter_jdbc.jar ApacheJMeter_mail.jar jmeter-plugins-manager-0.12.jar
ApacheJMeter_functions.jar ApacheJMeter_jms.jar ApacheJMeter_mongodb.jar JMeterWebSocketSamplers-0.10.jar


Jmeter Tips & Tricks – Tip 8

Tip 8 – Generating a specific amount of hits per second

JMeter is generally oriented towards a performance test approach where the load is based on a specific set of concurrent users, or threads. When talking metrics with systems engineers however, you will generally hear something more towards hits per second, requests per second or transactions per second. So how do you get JMeter to generate a certain amount of hits per second?

There are of course several ways to go about this, but in this article I will limit myself to a fairly simple method, using a Timer.

Constant Throughput Timer

constant throughput timer
The Constant Throughput Timer can be very useful in generating a (surprise!!) constant throughput.

What this timer does, is make sure that, regardless of the amount of threads you have started, the test will pause whenever needed to throttle the amount of requests per second. It is good to note by the way, that the timer is NOT based on milliseconds or seconds, but instead is counting per minute.

When your requirements state that the application (and server) should manage to survive some 60 hits/second, you will need to calculate your hits per second back to the actual amount of hits per minute (e.g. 10 hits/second * 60 seconds = 600 hits/min).

Keep in mind that there may be a difference in your load requirements, you have to really dig up from your customer/product owner or whoever came up with the performance requirements what exactly they expect. When they define hits per second, what do they mean with that? is that pageviews or is that actual requests (e.g. 1 page can consist of more requests for HTML, CSS, JS, Images etc.). Always verify and double check that what you mean with hits per second or requests per second is indeed what they also mean!

Understanding the “Calculate Throughput based on” variable constant throughput timer

There are several ways the throughput can be calculated and enforced. The default setting is “this thread only“, in my eyes however the most logical setting (based on the above requirements) is the “all active threads” setting.

  • this thread only – each thread, as defined in your Thread Group thread properties, will try to stick to the target throughput. This means that when you have 150 threads, your throughput will be 150 * Target throughput.
  • all active threads in current thread group – the target throughput is divided across the active threads in the thread group. In other words, this will give you the actual target throughput as you have configured. This throughput is for this specific thread group only! Threads themselves are delayed and started based on when this particular thread last ran. e.g.
  • all active threads – When you have more than one thread group, this setting becomes interesting. This will divide the target throughput across all active threads in all Thread Groups. Be aware, each Thread Group requires a Constant Throughput timer with the same settings for this to work.
  • all active threads in current thread group (shared) – Each thread is delayed based on when any thread in the group last ran, meaning the threads run consecutively rather than concurrently. For the rest this setting does exactly the same as the “all active threads in current threadgroup”, e.g. this will give you the actual target throughput as you have configured.
  • all active threads (shared) – Each thread is delayed based on when any thread in the group last ran, meaning the threads run consecutively rather than concurrently. Any thread here has again a wider meaning than in the previous setting, this setting runs across all threads and thread groups you have configured.

How do you know which setting you need?

These different settings can be quite confusing to any Jmeter user, even to experienced users. I would therefore recommend the following:

Make sure you put the constant throughput timer in the root of your testplan (e.g. at the highest level) and let it dictate the throughput of all of your threads and thread groups, e.g. “all active threads“. That way you know for sure what the actual throughput if your test is.

In the case of a somewhat complex environment, where you have several thread groups with each different amounts of requests per second, make sure you set the timer within the root of that particular thread group and stick to the “all threads in current thread group“.

Jmeter Tips & Tricks – Tip 7

Tip 7 – adjusting the JVM HEAP size, why and how to

When running JMeter tests, it may happen that the test is not successful and JMeter crashes with an OutOfMemoryError. This can happen due to all kinds of things, most of the time however you are trying to generate too many threads with an insufficient amount of memory allocated to your Java Virtual Machine. More information on what the HEAP is, how the JVM deals with the HEAP can be found here.

The HEAP size is defined on startup of your java application, in our case when we start JMeter. In other words, adjusting the HEAP means we will need to adjust the startup script. The startup script can be found in your JMeter “bin” directory. In my case, on a linux environment, it can be found here:

/opt/apache-jmeter-3.1/bin

When opening the “jmeter” file in your favorite editor, scroll down until you hit a line stating the following (on Windows based systems open “jmeter.bat”):

# This is the base heap size -- you may increase or decrease it to fit your
# system's memory availability:
HEAP="-Xms512m -Xmx512m"

On Windows systems the line looks slightly different, in the jmeter.bat, due to the nature of BATCH files and DOS working differently from Linux systems

set HEAP=-Xms512m -Xmx512m

When you adjust this line to read something like this:

# This is the base heap size -- you may increase or decrease it to fit your
# system's memory availability:
HEAP="-Xms1024m -Xmx4096m"

the HEAP size will by default be larger, meaning you do not have to think about it anymore when starting JMeter. This does pose one possible challenge, it slows down the startup of JMeter somewhat (at least on most machines I have done it). This seems to be because the JVM will first allocate all the memory you defined in the Xms param, ensuring the JVM is at the appropriate size instantly.

So, we changed the values of Xms and Xmx, what do these two mean?

-Xms ==> minimum heap size. This is the value JAVA will attempt to claim in order to run JMeter. This does NOT imply that it immediately gets this fully allocated by the OS. The OS typically doesn't give an application all blocks it asks for until really needed.
-Xmx ==> maximum heap size. This is the value JAVA will use as a maximum size of the JVM. When JMeter passes this level, an OutOfMemoryError will occur once more.

An alternative, more flexible setup to change the heapsize is to pass the JVM arguments on the commandline when starting JMeter. This of course assumes you are comfortable in commandline and start JMeter from commandline.

[user@machine ]$ JVM_ARGS="-Xms1024m -Xmx2048m" jmeter

Be Aware!

Please always make sure you leave enough memory for your OS and other applications to run on your machine when allocating more HEAP space to a JVM. Not leaving enough memory for your OS to keep running will result in your machine simply being non-responsive and thus your test and testresults being rendered useless.


Jmeter Tips & Tricks – Tip 6

Tip 6 – Effective use of Transaction Controllers

Whether you are trying to script a website, a webservice or something else, quite often you find that one functional action results in several requests to a server.

Take for example an average login-request seen from a functional point of view:

LoginScreen
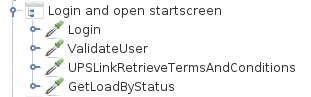
A user types in username & password and hits the Login button.
If the username/password combination was valid the user is than shown a dashboard.

This seems straight forward enough from a functional point of view. What actually happens however is a bit more than just this one request:

  • Username/password are sent to an authentication service
  • Authentication service sends an authenticated message back (assuming you are indeed authenticated by the application).
  • The authentication message contains a redirect away from the authentication service to the dashboard a user expects. This redirect contains information such as the AuthToken that was just recieved from the service.
  • Subsequent requests for the Dashboard-contents are sent.

In a simple setup, this may require only 1 request in Jmeter, just the login. Since Jmeter can take care of any redirecting itself.

Making Jmeter responsible for blindly following all redirects however, does not always give you the performance metrics you may want or need. When you need to know exactly which part of the login sequence is giving your users some form of grief, you may want to build these requests completely yourself in Jmeter. That will give you the possibility to see if there is high latency, big loads etc. on a per-request basis.

You may end up with something like this: jmeter-4requests

The 4 requests you see in this example are all separate requests used to log a user into the system and get the base information for the first screen of the application.

This sequence could have been captured in 1 request, Login, since the other requests are handled by HTTP/302 responses.

By building the requests yourself and clustering them together in a Logic Controller you now can see and measure how long the entire login request, step by step, takes. The Logic Controller I have used here is a Transaction Controller, this controller can add all child-transactions into one single response time for you by setting the appropriate flag. TransactionController
When set, “Generate parent sample” will ensure that your statistics have a single statistic for the complete set of requests, yet you can easily gain information on the separate requests while running a loadtest by unchecking this flag and looking into each step by itself as well.

This gives you the possiblity to find out which of the steps slows the entire transaction of logging in to your application (or whichever functional step you define in a Transaction Controller of course) .

Jmeter Tips & Tricks – Tip 5

Tip 5 – Logging made easy

Generally speaking it is useful to write your logs to file when running tests. This will help reproduce your results later on, make life easy with comparing results of different tests and will serve as a useful audit log for your load report later on.
The easy way to save the log is to add a filename string in the “Write results to file” box of your listener like this:

ViewResultsTreeWriteToFile

As you can see in this example I generally specify the logname to be at least a bit meaningful, e.g. which Listener did I use and how many threads did I start (the latter is not visible in this sample).

You do however quite regularly run the same amount of threads more than once, so how do you make clear which run this was? Updating the filename very quickly becomes an nuisance. So why not automate that?

I generally use the ${__time()} function. Making the filename something like this:
${__time(yyyyMMdd-HHmmss)}-LISTENERNAME-NUMBEROFTHREADS.jtl

ViewResultsInTableWriteToFile

This kind of logging results in a set of files which is easily sortable on filename and easily readable based on the amount of threads started for this particular test:

20160404-103706-resultsInTable-10threads.jtl