Real time location sharing without Google, Apple or any of the other big names

I have been travelling back and forth quite a bit recently to different locations and the family likes to see where I am and of course whether I am close by yet.

Since I left the Google ecosystem quite a few years ago I now faced a small challenge, how to share my location with my wife and children? I have no Google Maps installed on my phone, WhatsApp is too closely connected to Facebook for my taste and so far other apps I have seen enjoy keeping my movement history  a bit too much for comfort. Yet I still wanted to share my location, including updates of my (real time) movements.

Luckily there is a wonderful open source tool for that: Hauk. With a simple lightweight server install and a simple app on the phone I now can share my real time location and moving speed (that will be fun in a train to Paris at some point) showing on my own server with an OpenStreetMap based map.  Works miracles! Long live Open Source!

Yes, it is a bit of a hassle having to run your own server somewhere. However it is worth it! And… if you really want to, you can share your Hauk server of course. It is password protected, so all you need is to give someone the URL and a password.

Leaving the Google ecosystem behind

For once a more personal note and not directly related to my work in performance testing. Yet it is inspired by my work in software security, which makes me probably a bit more paranoid about privacy matters than other people.

I posted on LinkedIn about my move to get my Calendar and Contacts out of the grasp of Google, which got quite a few responses. One of the responses was from an old colleague who asked the following:

Interesting. Just killed my FB account and thinking about leaving Google… Inform me about your experiences!

So, Leonard, thanks for the inspiration,  here is your answer.

Some time around May/June 2016 I killed my (personal) FB account, since it feels like nothing but a drain on your time, adds no real value other than waiting for someone to add a “like”. Yeah sure, it may seem nice that you have all of your “friends” on there and it is so wonderful to stay in touch with your great-great-uncle from the middle-of-nowhere-in-Africa. But I completely lost interest. So I closed it, deleted it and threw the username and password out of my password manager.

Basically I stopped wanting to be the product, I wanted to be a customer again. Not some pawn in a complicated psychological game of how to get me to click on as many useless commercial links of junk I do not need.

Having left Facebook behind got me thinking that Facebook is only the first step. I needed go on to stop being a product and start being a customer again. I am a very happy and dedicated Android user, used to run Cyanogen, now running LineageOS on my phone. Why those? I actually get to choose what is on there, I do not have to accept the bloatware Samsung or some other vender wants to put on it to keep track of me and lock me in their ecosystem.

I then realiezd I am fully stuck in the Google ecosystem, using their mail, calendar, contacts, play store etc. That too had to change, so I started looking into leaving the Google Ecosystem as much as possible, starting with my mail.

When I started digging into possible solutions for mail instead of Google, I decided i did not want to host stuff like that, on which my work and livelyhood depend, at home. I want some professional company to look after my mail. On top of that I decided I still wanted to ensure CIA, AIVD, Sleepwet etc cannot (easily) keep track of my mails, let alone that my hosting company can read my mails to again give me banners in my face.

I opened an account at Tutanota and one on ProtonMail to compare the interface and possibilities of these two. They are quite similar in terms of privacy, however Tutanota has the added benefit of custom domains, catch-all email addresses etc. so I went for Tutanoa. I started off immediately with a paid account, I believe that a good initiative like Tutanota or Protonmail, but also all of their competitors, should be supported. No freeloading on stuff like that for me.

I then moved all my personal correspondence to Tutanota. This started to work very well for me, their (web)client still has a few kinks to fix and new features that are badly needed, but after a year of using them I am very happy with them.  I now have 2 mail domains hosted at Tutanota, one personal and one business account. Both are paid, both are safe and both are working very very well for me.

Next up I started to try to get as much away from the Google play store as possible, since that too adds to the tracking and the concept that you are the product. Instead I try to use as much as possible, F-Droid. So far, that is less easy than I had hoped for, but my first go-to android store for the past 6 months has been F-droid.

The one thing Google of course still truly rocks at is search. I was hesitant to leave them for search, their results are generally very good. Which is of course no surprise, since they seem to know me better than my wife knows me. Moving away from google for search was a bit of a no-brainer in the end., Although I so now and again have to use Google anyway. But then I use it in a “private browsing” session. Google search was replaced by DuckDuck Go, also available for your android or ios device. DuckDuckGo is now the default search engine on my laptop as well as on my mobile devices. Sure I need to come up with better search queries so now and again, but at least they are not tracking me so badly as Google is doing.

The last thing I still had in the Google ecosystem were Contacts and Calendar. Since these are not integrated within my mail provider, I had to look for a good alternative. In the end I decided to opt for a privately hosted nextCloud instance. Privately hosted since I do not want to add more costs to hosting things and on top of that, my stellar router can easily handle my calendar and contacts behaviour. I synchronize them via a VPN connection to my home.

These last steps, calendar and contacts, I finished some 24 hours ago, I have since killed the automatic synchronization to the Google servers in my android settings and am giving it 1 week before I remove all contacts from my last google account. Once that is done I will only have 1 thing still within the Google ecosystem, that is my Google Play account for the few things I cannot get from F-Droid.

Looking back at it all, I have in the last year and a half not had any regret of closing facebook and getting google more out of my life.

JMeter Tips & Tricks – Tip 10

Tip 10 – Installing Jmeter-Plugins from commandline

So, you’ve built a beautiful script, now you want to run it from one or more remote servers. These servers are setup, you downloaded the JMeter zit, unzipped it and all. Since you will be running off a server there is no big fat GUI to install the oh so needed JMeter Plugins though.

What do you do to make those work?

Thankfully since version 3.* this has become fairly easy. The JMeter Plugin Manager was introduced and with that comes the PluginsManagerCMD (be it the .bat or the .sh)

When running the PluginsManagerCMD however it is not very friendly in its messaging:

./PluginsManagerCMD.sh 
ERROR StatusLogger No log4j2 configuration file found. Using default configuration: logging only errors to the console. Set system property 'org.apache.logging.log4j.simplelog.StatusLogger.level' to TRACE to show Log4j2 internal initialization logging.
Options for tool 'PluginManagerCMD': <command> <paramstr> where <command> is one of: help, status, available, upgrades, install, install-all-except, uninstall.
ERROR: java.lang.IllegalArgumentException: Command parameter is missing
*** Problem's technical details go below ***
Home directory was detected as: /run/media/martijndevrieze/Data/Downloads/builds/jmeter-nightly/apache-jmeter-r1802079/lib
Exception in thread "main" java.lang.IllegalArgumentException: Command parameter is missing
   at org.jmeterplugins.repository.PluginManagerCMD.processParams(PluginManagerCMD.java:20)
   at kg.apc.cmdtools.PluginsCMD.processParams(PluginsCMD.java:66)
   at kg.apc.cmdtools.PluginsCMD.processParams(PluginsCMD.java:22)
   at sun.reflect.NativeMethodAccessorImpl.invoke0(Native Method)
   at sun.reflect.NativeMethodAccessorImpl.invoke(NativeMethodAccessorImpl.java:62)
   at sun.reflect.DelegatingMethodAccessorImpl.invoke(DelegatingMethodAccessorImpl.java:43)
   at java.lang.reflect.Method.invoke(Method.java:498)
   at kg.apc.cmd.UniversalRunner.main(UniversalRunner.java:105)

So, what exactly are you supposed to do with this script?

Somewhere in between the errors is a useage message:

Options for tool 'PluginManagerCMD': <command> <paramstr> where <command> is one of: help, status, available, upgrades, install, install-all-except, uninstall.

As it turns out, you can get this info with a bit less error information when running the simple command:

./PluginsManagerCMD.sh help

I started out with checking the status of the PluginsManager:

./PluginsManagerCMD.sh status
ERROR StatusLogger No log4j2 configuration file found. Using default configuration: logging only errors to the console. Set system property 'org.apache.logging.log4j.simplelog.StatusLogger.level' to TRACE to show Log4j2 internal initialization logging.
[jpgc-plugins-manager=0.12, jmeter-core=r1802079, jmeter-ftp=r1802079, jmeter-http=r1802079, jmeter-jdbc=r1802079, jmeter-jms=r1802079, jmeter-junit=r1802079, jmeter-java=r1802079, jmeter-ldap=r1802079, jmeter-mail=r1802079, jmeter-mongodb=r1802079, jmeter-native=r1802079, jmeter-tcp=r1802079, jmeter-components=r1802079]

We now have an overview of the plugins installed in JMeter, nothing out of the standard packaged set.

Now let’s install some plugins, for that the following command is needed:

./PluginsManagerCMD.sh install  <paramstr>

Where the <paramstr> needs to be filled with something sensible. This something sensible is the ID of the plugin you want to install.

You can find the ID’s on the Jmeter-Plugins site in the menu item “Browse plugins”. Look at the plugin(s) you need and grab the accompanying ID:

jmeterpluginID

For the sake of this example the command will be:

./PluginsManagerCMD.sh install websocket-samplers

Unfortunately JMeter will not provide you any feedback while running this. The only easy way to verify that the plugin is there is by either running the script that needs this plugin, or checking your jmeter lib/ext directory:

ls ../lib/ext/
ApacheJMeter_components.jar ApacheJMeter_http.jar ApacheJMeter_junit.jar ApacheJMeter_native.jar readme.txt
ApacheJMeter_core.jar ApacheJMeter_java.jar ApacheJMeter_ldap.jar ApacheJMeter_tcp.jar
ApacheJMeter_ftp.jar ApacheJMeter_jdbc.jar ApacheJMeter_mail.jar jmeter-plugins-manager-0.12.jar
ApacheJMeter_functions.jar ApacheJMeter_jms.jar ApacheJMeter_mongodb.jar JMeterWebSocketSamplers-0.10.jar


Jmeter Tips & Tricks – Tip 9

Tip 9 – Generating a report from your log file

When running a performance test with Jmeter it is generally adviced to run the test  in non-gui mode and to log your responses to a file. My typical command for a performance test looks something like this:

Jmeter –n –t TestScenario.jmx –j jmeter-TestRun01.log –l yyyyMMdd-TestRun-10000Threads-300TPS.jtl

Where the commandline flags have the following meaning:

-n => Non-GUI

-t => the testscenario JMX file to run as  a test

-j => where to write the Jmeter logfile

-l => where to write the sample results to. This typically gets a JTL-extension

Once you have run your test successfully the real work of a performance tester starts, analyzing the outcomes and communicating the results and of course providing advice what to do with these results.

For the result-graphs you can of course use the Jmeter Listeners. You can also use Excel. But neither are a very easy nor a friendly way to do it.

Generally speaking a bit of JTL log is not very friendly to read:

timeStamp,elapsed,label,responseCode,responseMessage,threadName,dataType,success,failureMessage,bytes,sentBytes,grpThreads,allThreads,URL,Latency,Encodi
ng,SampleCount,ErrorCount,IdleTime,Connect
1504276591952,296,GET - Login screen,200,OK,jp@gc - Ultimate Thread Group - EA-OP 1-100,text,true,,523937,1116,1,1,https://poc-15.educus.nl/app/login,10
5,UTF-8,1,0,0,86
1504276592251,259,GET - Login screen,200,OK,jp@gc - Ultimate Thread Group - EA-OP 1-99,text,true,,523937,1116,2,2,https://poc-15.educus.nl/app/login,93,
UTF-8,1,0,0,77
1504276592552,282,GET - Login screen,200,OK,jp@gc - Ultimate Thread Group - EA-OP 1-98,text,true,,523937,1116,3,3,https://poc-15.educus.nl/app/login,98,
UTF-8,1,0,0,80
1504276592851,292,GET - Login screen,200,OK,jp@gc - Ultimate Thread Group - EA-OP 1-97,text,true,,523937,1116,4,4,https://poc-15.educus.nl/app/login,105
,UTF-8,1,0,0,88
1504276593151,254,GET - Login screen,200,OK,jp@gc - Ultimate Thread Group - EA-OP 1-96,text,true,,523937,1116,5,5,https://poc-15.educus.nl/app/login,97,
UTF-8,1,0,0,80
1504276593451,212,GET - Login screen,200,OK,jp@gc - Ultimate Thread Group - EA-OP 1-95,text,true,,523937,1116,6,6,https://poc-15.educus.nl/app/login,87,
UTF-8,1,0,0,72
1504276593751,225,GET - Login screen,200,OK,jp@gc - Ultimate Thread Group - EA-OP 1-94,text,true,,523937,1116,7,7,https://poc-15.educus.nl/app/login,89,
UTF-8,1,0,0,73
1504276594051,210,GET - Login screen,200,OK,jp@gc - Ultimate Thread Group - EA-OP 1-93,text,true,,523937,1116,8,8,https://poc-15.educus.nl/app/login,90,
UTF-8,1,0,0,74
1504276594351,214,GET - Login screen,200,OK,jp@gc - Ultimate Thread Group - EA-OP 1-92,text,true,,523937,1116,9,9,https://poc-15.educus.nl/app/login,88,
UTF-8,1,0,0,73
1504276594651,228,GET - Login screen,200,OK,jp@gc - Ultimate Thread Group - EA-OP 1-91,text,true,,523937,1116,10,10,https://poc-15.educus.nl/app/login,9
1,UTF-8,1,0,0,75

Thankfully JMeter has a very nice, although not very elegant solution to this. I consider this not very elegant since you can only trigger it via commandline. The results however are quite elegant and pretty to view.

Run the following command to get your pretty report once your test is finished:

jmeter -g yyyyMMdd-TestRun-10000Threads-300TPS.jtl -o WriteThisToACleanDirectory

This generates a very nice HTML/js based reporting dashboard. I will refrain from going into details about how nice the dashboard has become over the years, you can read all that is in the dashboards on the Apache Jmeter site.

The landing page may look something like this:
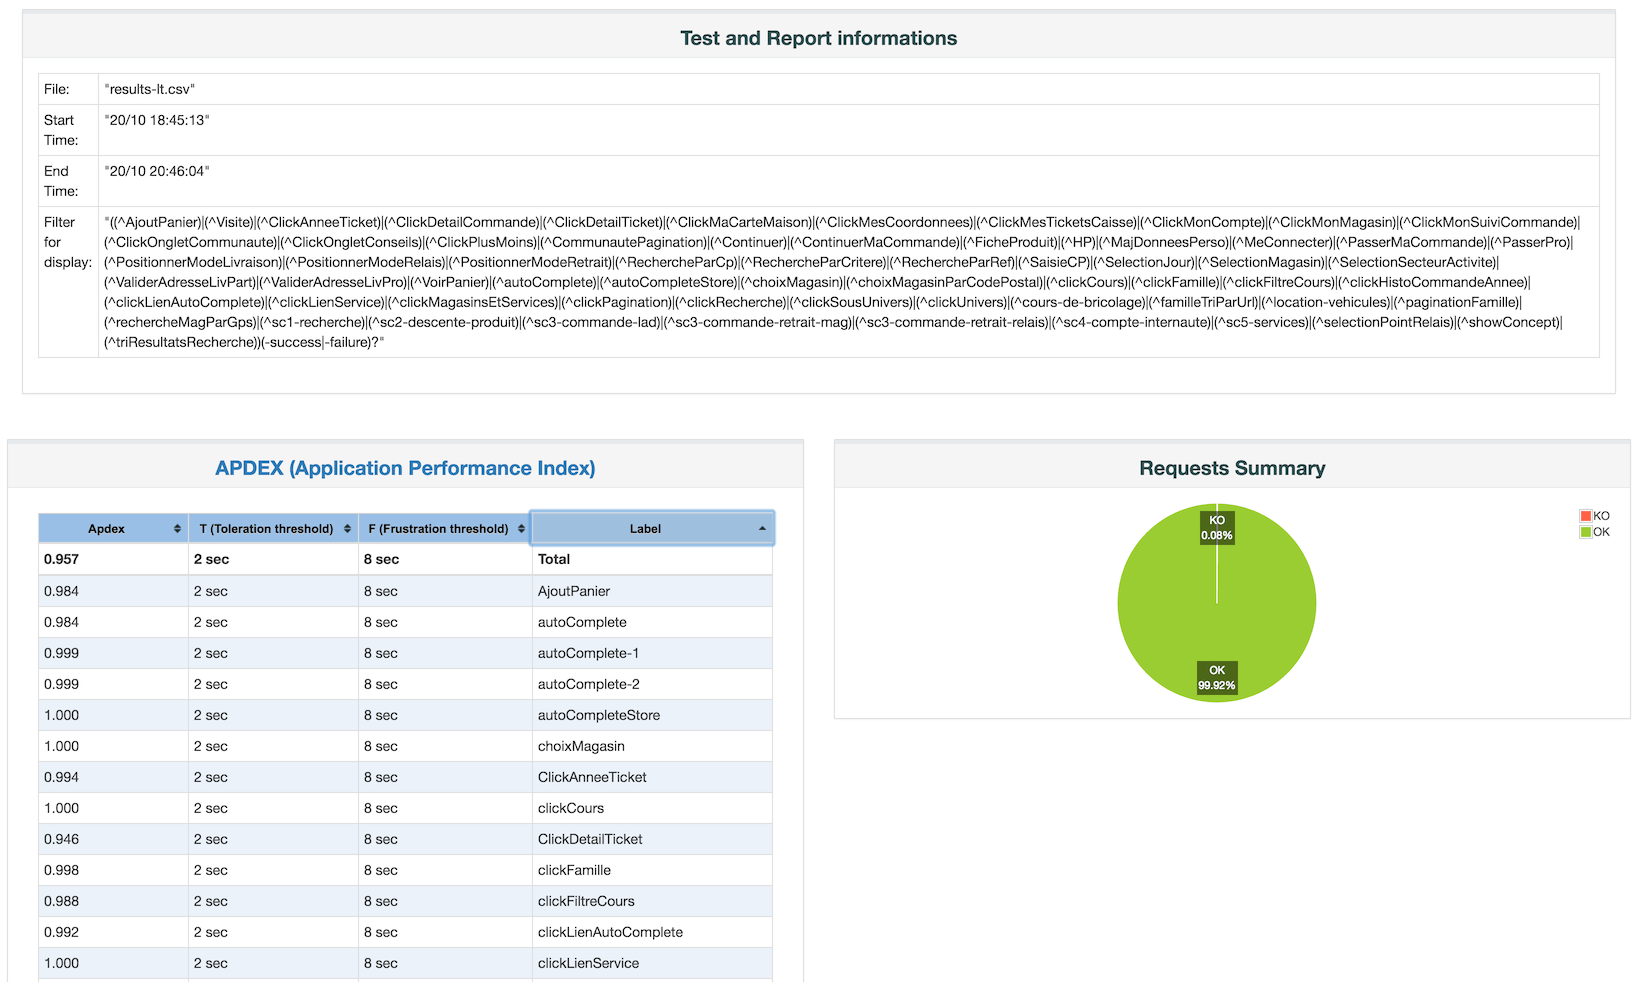
The graphs on the dashboard are all ineractive, you can zoom in on specific details, filter out specifi requests etc. I really like what has become of these reports.

The negative side of that way of generating a report is that you still have to do it once you are done running your performance tests.

That too can be solved! When running tests from a commandline I generally use a command close to this:

jmeter -n -t TestScenario.jmx -j jmeter-TestRun01.log -l yyyyMMdd-TestRun-10000Threads-300TPS.jtl -e -o OUTPUTDIRECTORY > /dev/null 2>&1 &

The addition of the dashboard generation is done with the

-e -o OUTPUTDIRECTORY

flags and arguments. The little extra sauce I give is that I generally open a second console where I tail the JMeter log and potentially the JTL log. So in my main window, where I started the testrun, I prefer to have my commandline available to do useful things such as shutdown JMeter if so required. Hence I send the console output to

/dev/null

and send any possible error stream directly to the output stream (which again is sent into the void that is /dev/null

Last but not least I background the process with the & in order for me to have my console back and available.


Jmeter Tips & Tricks – Tip 8

Tip 8 – Generating a specific amount of hits per second

JMeter is generally oriented towards a performance test approach where the load is based on a specific set of concurrent users, or threads. When talking metrics with systems engineers however, you will generally hear something more towards hits per second, requests per second or transactions per second. So how do you get JMeter to generate a certain amount of hits per second?

There are of course several ways to go about this, but in this article I will limit myself to a fairly simple method, using a Timer.

Constant Throughput Timer

constant throughput timer
The Constant Throughput Timer can be very useful in generating a (surprise!!) constant throughput.

What this timer does, is make sure that, regardless of the amount of threads you have started, the test will pause whenever needed to throttle the amount of requests per second. It is good to note by the way, that the timer is NOT based on milliseconds or seconds, but instead is counting per minute.

When your requirements state that the application (and server) should manage to survive some 60 hits/second, you will need to calculate your hits per second back to the actual amount of hits per minute (e.g. 10 hits/second * 60 seconds = 600 hits/min).

Keep in mind that there may be a difference in your load requirements, you have to really dig up from your customer/product owner or whoever came up with the performance requirements what exactly they expect. When they define hits per second, what do they mean with that? is that pageviews or is that actual requests (e.g. 1 page can consist of more requests for HTML, CSS, JS, Images etc.). Always verify and double check that what you mean with hits per second or requests per second is indeed what they also mean!

Understanding the “Calculate Throughput based on” variable constant throughput timer

There are several ways the throughput can be calculated and enforced. The default setting is “this thread only“, in my eyes however the most logical setting (based on the above requirements) is the “all active threads” setting.

  • this thread only – each thread, as defined in your Thread Group thread properties, will try to stick to the target throughput. This means that when you have 150 threads, your throughput will be 150 * Target throughput.
  • all active threads in current thread group – the target throughput is divided across the active threads in the thread group. In other words, this will give you the actual target throughput as you have configured. This throughput is for this specific thread group only! Threads themselves are delayed and started based on when this particular thread last ran. e.g.
  • all active threads – When you have more than one thread group, this setting becomes interesting. This will divide the target throughput across all active threads in all Thread Groups. Be aware, each Thread Group requires a Constant Throughput timer with the same settings for this to work.
  • all active threads in current thread group (shared) – Each thread is delayed based on when any thread in the group last ran, meaning the threads run consecutively rather than concurrently. For the rest this setting does exactly the same as the “all active threads in current threadgroup”, e.g. this will give you the actual target throughput as you have configured.
  • all active threads (shared) – Each thread is delayed based on when any thread in the group last ran, meaning the threads run consecutively rather than concurrently. Any thread here has again a wider meaning than in the previous setting, this setting runs across all threads and thread groups you have configured.

How do you know which setting you need?

These different settings can be quite confusing to any Jmeter user, even to experienced users. I would therefore recommend the following:

Make sure you put the constant throughput timer in the root of your testplan (e.g. at the highest level) and let it dictate the throughput of all of your threads and thread groups, e.g. “all active threads“. That way you know for sure what the actual throughput if your test is.

In the case of a somewhat complex environment, where you have several thread groups with each different amounts of requests per second, make sure you set the timer within the root of that particular thread group and stick to the “all threads in current thread group“.