Jmeter Tips & Tricks – Tip 8

Tip 8 – Generating a specific amount of hits per second

JMeter is generally oriented towards a performance test approach where the load is based on a specific set of concurrent users, or threads. When talking metrics with systems engineers however, you will generally hear something more towards hits per second, requests per second or transactions per second. So how do you get JMeter to generate a certain amount of hits per second?

There are of course several ways to go about this, but in this article I will limit myself to a fairly simple method, using a Timer.

Constant Throughput Timer

constant throughput timer
The Constant Throughput Timer can be very useful in generating a (surprise!!) constant throughput.

What this timer does, is make sure that, regardless of the amount of threads you have started, the test will pause whenever needed to throttle the amount of requests per second. It is good to note by the way, that the timer is NOT based on milliseconds or seconds, but instead is counting per minute.

When your requirements state that the application (and server) should manage to survive some 60 hits/second, you will need to calculate your hits per second back to the actual amount of hits per minute (e.g. 10 hits/second * 60 seconds = 600 hits/min).

Keep in mind that there may be a difference in your load requirements, you have to really dig up from your customer/product owner or whoever came up with the performance requirements what exactly they expect. When they define hits per second, what do they mean with that? is that pageviews or is that actual requests (e.g. 1 page can consist of more requests for HTML, CSS, JS, Images etc.). Always verify and double check that what you mean with hits per second or requests per second is indeed what they also mean!

Understanding the “Calculate Throughput based on” variable constant throughput timer

There are several ways the throughput can be calculated and enforced. The default setting is “this thread only“, in my eyes however the most logical setting (based on the above requirements) is the “all active threads” setting.

  • this thread only – each thread, as defined in your Thread Group thread properties, will try to stick to the target throughput. This means that when you have 150 threads, your throughput will be 150 * Target throughput.
  • all active threads in current thread group – the target throughput is divided across the active threads in the thread group. In other words, this will give you the actual target throughput as you have configured. This throughput is for this specific thread group only! Threads themselves are delayed and started based on when this particular thread last ran. e.g.
  • all active threads – When you have more than one thread group, this setting becomes interesting. This will divide the target throughput across all active threads in all Thread Groups. Be aware, each Thread Group requires a Constant Throughput timer with the same settings for this to work.
  • all active threads in current thread group (shared) – Each thread is delayed based on when any thread in the group last ran, meaning the threads run consecutively rather than concurrently. For the rest this setting does exactly the same as the “all active threads in current threadgroup”, e.g. this will give you the actual target throughput as you have configured.
  • all active threads (shared) – Each thread is delayed based on when any thread in the group last ran, meaning the threads run consecutively rather than concurrently. Any thread here has again a wider meaning than in the previous setting, this setting runs across all threads and thread groups you have configured.

How do you know which setting you need?

These different settings can be quite confusing to any Jmeter user, even to experienced users. I would therefore recommend the following:

Make sure you put the constant throughput timer in the root of your testplan (e.g. at the highest level) and let it dictate the throughput of all of your threads and thread groups, e.g. “all active threads“. That way you know for sure what the actual throughput if your test is.

In the case of a somewhat complex environment, where you have several thread groups with each different amounts of requests per second, make sure you set the timer within the root of that particular thread group and stick to the “all threads in current thread group“.
Reusable components in JMeter – Part 2, Include Controller

In an earlier post I discussed why you might want to use reusable components in Jmeter scripts, in that post I only focused on one possible way of doing that, the Module Controller. For the second part, as promised, I want to discuss the possible uses of the Include Controller.

Why use the Include Controller?

The include controller pretty much does what it states, it allows you to include something external into your test scenario. With controller you can include other JMX files into one single JMX file. So imagine a similar scenario as in the previous post, where you create a JMX specifically for the registration on an application, but then through different channels.

Example: A given application has several ways to communicate to it:

  • Consumer webclient
  • Backoffice webclient
  • Mobile application (communicating via an API)

You can build a set of functional load scenarios for each side of the application, resulting in something like a frontend.jmx, backend.jmx and api.jmx

If you now want to have some full performancetests on the application you can combine these sets with the Include Controller into one big set without making it a huge, unmanageable JMX file.

How does it work?

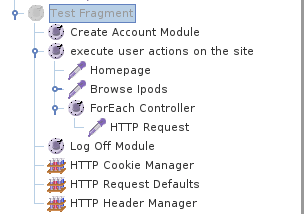
In the JMX files as mentioned above, instead of a Thread Group you now use a Test Fragment to place your test steps in. If you do happen to use a Thread Group the settings for the thread group from the original JMX will be overridden with the settings from the thread group where the JMX is included.

To avoid confusion, the Test Fragment should be used instead.

TestFragment

Given the existing JMX files you need to use, you create a new project in Jmeter, which will be your master controller. Once you have built the different scenarios you need for your full scale performance test, you consider how these three should work together. Running 3 different JMeter instances, each with its own JMX is an option, however it will make life so much easier if you can actually create a proper flow with the different JMX files.
This Script will be relatively simple and may end up looking something like this:
IncludeControllerYou can now easily control several scripts, from within one or more thread groups within 1 Jmeter instance while still keeping things maintainable and reusable.


JMeter and WebDriver – 2 ways to combine them effectively

In my previous post I wrote about why it can be useful to combine running load tests in combination with functional automated tests (checks). In this post I will go in a bit deeper and give some ways to combine the two effectively and efficiently. Apache JMeter plus-2-256 Selenium Logo

2 ways to combine JMeter and WebDriver effectively

The two ways to combine Jmeter and WebDriver I will describe differ quite a bit. Depending on your situation you may want to choose one or the other for your purposes. Keep in mind, these are ideas of how I have used the two effectively together, this is not necessarily the best way for you!

Existing webdriver tests

Quite a lot of organisations already have a fairly solid base of testautomation in place, in various states of success. A relatively easy way to get performance metrics for your application is to add a timer to your existing webdriver automation scripts. For every (relevant and useful) action in the browser, you can add a start and done timer, resulting in the actual wait-time within the browser. This timer can be in an “always on” state within your automation suite. It will generate quite some data, which is not a bad thing. When you keep track of your metrics over the course of a complete cycle, for example throughout a sprint, these metrics will help give you and your team insights into possible performance regression.

Performance regression over several releases – Image linked from devel.kostdoktorn.se

While this will give you valuable information, it does not yet give you hard data of how the application runs when put under stress. In order to do that, you will have to create a separate load suite. The load suite will need to contain functional tests, similar to the ones you are running during regular (automated) regression. This way you are certain you are putting your business logic under stress and thus may slow the application down significantly. If your test environment is representative enough, or if you actually benchmarked it beforehand, you can add the Jmeter script to your automated run at planned intervals to start building up load on the server prior to the start of the full browser automated test run. Otherwise on a representative environment you can run the JMeter scripts to generate load, once the target load is reached, you can start your regular automated functional tests,

Advantages

The main advantage is that you are actively encouraged to reuse your existing automated tests. The tests under load are easily compared to the benchmark you make on a daily basis without load.

Challenges

Unfortunately there is no easyway to get to unified reporting other than to generate a set of CSV files and merge those.

Stand-alone performance measurement

As a consultant I also often end up in an organisation where there is no functional automation to reuse for a performance test. In this case I use a fully JMeter based solution for executing the performancetest, Both load generation as well as page-load times (e.g. browser rendering included) are run from JMeter. jmeter-pluginsIn order to run browser-based tests from JMeter I use the wonderful work of the people over at Jmeter-Plugins. They have created a host of wonderful plugins, but for this particular purpose I am very fond of their WebDriver Set.
The WebDriver plugins in JMeter allow you to write JavaScript testscenarios in Jmeter, which actually use the browser. This combined with the regular load tests from within Jmeter make for a strong performancetest.

Advantages

With this solution you achieve a very easy and quick way to get one unified reporting, from within the toolset showing the performance of your application, both the server response times as well as the browser response times.

Challenges

If you already have a testautomation suite running as well, taking this road implies setting up a second testsuite specifically tailored for performancetesting. The lack of reuse of existing tests makes this quite often the more expensive way of performance testing.

JMeter and remote servers – a tutorial

In my previous post I discussed why you might want to run your own servers for load & performance testing. In this article I will elaborate a bit on how to setup your machines. The Apache Jmeter pages of course have an explanation on how to setup remote tests. What I have heard from colleagues and what I experienced myself, is that that explanation is not always as clear and concise as may be preferred. This is my attempt at giving a readable explanation on how to setup JMeter with remote instances.

Some basic terminology

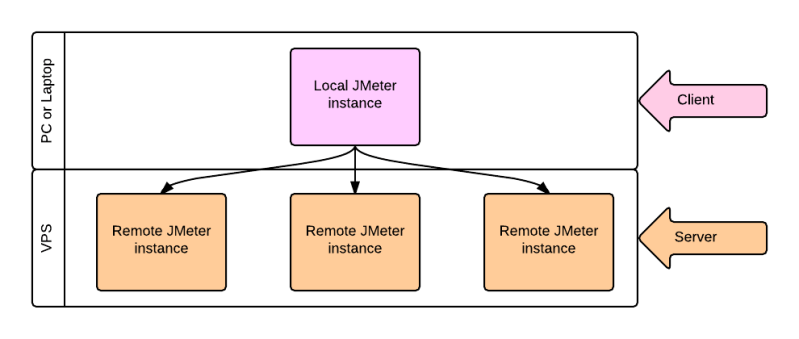
I will use the terms Local and Remote to identify the different sides of the configuration needed to get things working.

  • Local is to be read as your workstation, e.g. the machine you use to build your JMeter scripts.
  • Remote should be considered any machine that will be running a (headless) JMeter instance and will help generate load on an object.

jmeter Client - Service image

How to setup JMeter locally to work with remote machines

Continue reading

Reusable components in JMeter

Why do I need reusable components in a load script?

Ok, so generally speaking a load script may not really need reusable components you think. However there are plenty of reasons to actually use them and use them effectively, efficiently and heavily.

First of all, not all Jmeter load scripts are for a one off effort. There are quite some times that, if not entire scripts, then at least part of a script could be extremely useful to reuse. Think of a nice application, such as a webshop, you may be trying to stress out with Jmeter. While building it I hope the developers were thinking of reuse, so why wouldn’t you while building a script to stress that shop out?

Secondly, when building load scenarios, you may want to reuse a search function, a registration function, a login function, etc. So why not make a bunch of reusable modules or JMX scripts that help you build scenarios by just clicking existing things together rapidly rather than reinvent the wheel over and over for each and every scenario.

I am not even going to mention the default reasoning: standard practice of DRY: Don’t Repeat Yourself! (ok, there, I did it anyway)

Does JMeter allow for it?

Well, that one seems a bit obvious, since I am writing about it here of course 🙂 Yes Jmeter has a wonderful way of dealing with reuse:

All you need is a Module Controller

Jmeter 2.13 Module Controller

or an Include Controller (which I will write a brief how-to about in a followup post):

Jmeter 2.13 Include Controller

Jmeter 2.13 Include Controller

These two can basically do a similar thing, you can reuse either a module or reuse, and by reuse I mean include of course) a complete testplan in a test. The actual working and thus their use and usefullness is quite different though.

The Module Controller keeps everything within one testplan, whereas the Include Controller expects you to have several (at least 2) testplans to use and work with.

How do I use them

Module Controller

The Module Controller is a relatively easy one to explain as the first one. I use this method often when building scenarios which are relatively close to each other, for example for a webshop. The example I am going through below is a very simple basic one. Sticking to a basic description, since I mainly wanted to show that it is possible to use reusable components and how you can do it.
Imagine a few scenarios for a webshop:

Scenario 1:

  1. Create account
  2. While logged in browse the webshop
  3. Add items to your shopping cart
  4. Go through Checkout
  5. Log out of webshop

Scenario 2:

  1. Browse to the webshop
  2. Add items to your shopping cart
  3. Go to Checkout
  4. Create account on Checkout
  5. Go through checkout
  6. Log out of webshop

Scenario 3:

  1. Browse to the webshop
  2. Sign in to the webshop with an account with at least 1 purchase
  3. Do something the My Account
  4. Add items to shopping basket and leave them there
  5. Log Off

In these scenarios there are several steps that are repeated: Sign up for an account, log off, add some items to a basket. If you want to make sure you do not need to maintain these steps at different spots in your script, it make perfect sense to make these steps reusable. This is after all what you would do with test automation as well, right? Let’s do just that!

What do you need in Jmeter:

Testplan
 > <DISABLED>Threadgroup
    > Simple Controller with Signup steps
        > Samplers etc needed to run through the signup flow
    > Simple Controller with LogOff steps
</DISABLED>
  > Threadgroup
    > Module Controller - In this controller you can choose which controller you want to use. Select the Signup Controller
    > Simple Controller
        > Samplers etc. needed to execute the following steps

Your JMX could now look something like this:

JmeterModuleController

Include Controller


This will be coming along in a followup post at a later time.