Jmeter Tips & Tricks – Tip 9

Tip 9 – Generating a report from your log file

When running a performance test with Jmeter it is generally adviced to run the test  in non-gui mode and to log your responses to a file. My typical command for a performance test looks something like this:

Jmeter –n –t TestScenario.jmx –j jmeter-TestRun01.log –l yyyyMMdd-TestRun-10000Threads-300TPS.jtl

Where the commandline flags have the following meaning:

-n => Non-GUI

-t => the testscenario JMX file to run as  a test

-j => where to write the Jmeter logfile

-l => where to write the sample results to. This typically gets a JTL-extension

Once you have run your test successfully the real work of a performance tester starts, analyzing the outcomes and communicating the results and of course providing advice what to do with these results.

For the result-graphs you can of course use the Jmeter Listeners. You can also use Excel. But neither are a very easy nor a friendly way to do it.

Generally speaking a bit of JTL log is not very friendly to read:

timeStamp,elapsed,label,responseCode,responseMessage,threadName,dataType,success,failureMessage,bytes,sentBytes,grpThreads,allThreads,URL,Latency,Encodi
ng,SampleCount,ErrorCount,IdleTime,Connect
1504276591952,296,GET - Login screen,200,OK,jp@gc - Ultimate Thread Group - EA-OP 1-100,text,true,,523937,1116,1,1,https://poc-15.educus.nl/app/login,10
5,UTF-8,1,0,0,86
1504276592251,259,GET - Login screen,200,OK,jp@gc - Ultimate Thread Group - EA-OP 1-99,text,true,,523937,1116,2,2,https://poc-15.educus.nl/app/login,93,
UTF-8,1,0,0,77
1504276592552,282,GET - Login screen,200,OK,jp@gc - Ultimate Thread Group - EA-OP 1-98,text,true,,523937,1116,3,3,https://poc-15.educus.nl/app/login,98,
UTF-8,1,0,0,80
1504276592851,292,GET - Login screen,200,OK,jp@gc - Ultimate Thread Group - EA-OP 1-97,text,true,,523937,1116,4,4,https://poc-15.educus.nl/app/login,105
,UTF-8,1,0,0,88
1504276593151,254,GET - Login screen,200,OK,jp@gc - Ultimate Thread Group - EA-OP 1-96,text,true,,523937,1116,5,5,https://poc-15.educus.nl/app/login,97,
UTF-8,1,0,0,80
1504276593451,212,GET - Login screen,200,OK,jp@gc - Ultimate Thread Group - EA-OP 1-95,text,true,,523937,1116,6,6,https://poc-15.educus.nl/app/login,87,
UTF-8,1,0,0,72
1504276593751,225,GET - Login screen,200,OK,jp@gc - Ultimate Thread Group - EA-OP 1-94,text,true,,523937,1116,7,7,https://poc-15.educus.nl/app/login,89,
UTF-8,1,0,0,73
1504276594051,210,GET - Login screen,200,OK,jp@gc - Ultimate Thread Group - EA-OP 1-93,text,true,,523937,1116,8,8,https://poc-15.educus.nl/app/login,90,
UTF-8,1,0,0,74
1504276594351,214,GET - Login screen,200,OK,jp@gc - Ultimate Thread Group - EA-OP 1-92,text,true,,523937,1116,9,9,https://poc-15.educus.nl/app/login,88,
UTF-8,1,0,0,73
1504276594651,228,GET - Login screen,200,OK,jp@gc - Ultimate Thread Group - EA-OP 1-91,text,true,,523937,1116,10,10,https://poc-15.educus.nl/app/login,9
1,UTF-8,1,0,0,75

Thankfully JMeter has a very nice, although not very elegant solution to this. I consider this not very elegant since you can only trigger it via commandline. The results however are quite elegant and pretty to view.

Run the following command to get your pretty report once your test is finished:

jmeter -g yyyyMMdd-TestRun-10000Threads-300TPS.jtl -o WriteThisToACleanDirectory

This generates a very nice HTML/js based reporting dashboard. I will refrain from going into details about how nice the dashboard has become over the years, you can read all that is in the dashboards on the Apache Jmeter site.

The landing page may look something like this:

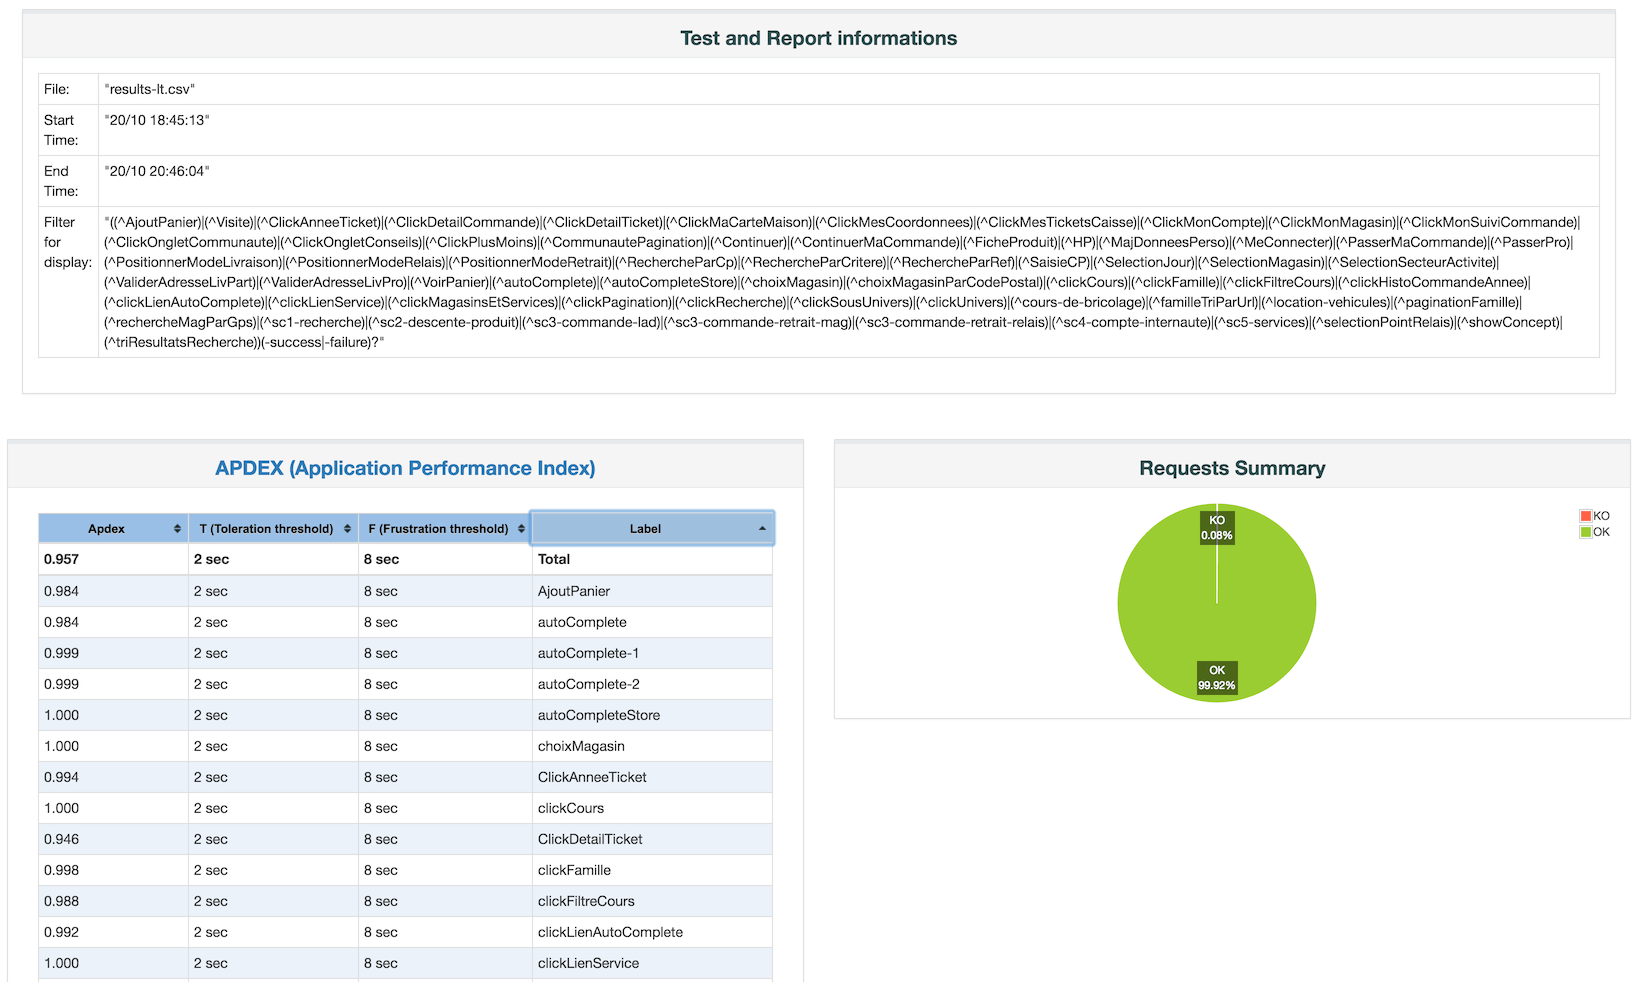
The graphs on the dashboard are all ineractive, you can zoom in on specific details, filter out specifi requests etc. I really like what has become of these reports.

The negative side of that way of generating a report is that you still have to do it once you are done running your performance tests.

That too can be solved! When running tests from a commandline I generally use a command close to this:

jmeter -n -t TestScenario.jmx -j jmeter-TestRun01.log -l yyyyMMdd-TestRun-10000Threads-300TPS.jtl -e -o OUTPUTDIRECTORY > /dev/null 2>&1 &

The addition of the dashboard generation is done with the

-e -o OUTPUTDIRECTORY

flags and arguments. The little extra sauce I give is that I generally open a second console where I tail the JMeter log and potentially the JTL log. So in my main window, where I started the testrun, I prefer to have my commandline available to do useful things such as shutdown JMeter if so required. Hence I send the console output to

/dev/null

and send any possible error stream directly to the output stream (which again is sent into the void that is /dev/null

Last but not least I background the process with the & in order for me to have my console back and available.


Jmeter Tips & Tricks – Tip 8

Tip 8 – Generating a specific amount of hits per second

JMeter is generally oriented towards a performance test approach where the load is based on a specific set of concurrent users, or threads. When talking metrics with systems engineers however, you will generally hear something more towards hits per second, requests per second or transactions per second. So how do you get JMeter to generate a certain amount of hits per second?

There are of course several ways to go about this, but in this article I will limit myself to a fairly simple method, using a Timer.

Constant Throughput Timer

constant throughput timer
The Constant Throughput Timer can be very useful in generating a (surprise!!) constant throughput.

What this timer does, is make sure that, regardless of the amount of threads you have started, the test will pause whenever needed to throttle the amount of requests per second. It is good to note by the way, that the timer is NOT based on milliseconds or seconds, but instead is counting per minute.

When your requirements state that the application (and server) should manage to survive some 60 hits/second, you will need to calculate your hits per second back to the actual amount of hits per minute (e.g. 10 hits/second * 60 seconds = 600 hits/min).

Keep in mind that there may be a difference in your load requirements, you have to really dig up from your customer/product owner or whoever came up with the performance requirements what exactly they expect. When they define hits per second, what do they mean with that? is that pageviews or is that actual requests (e.g. 1 page can consist of more requests for HTML, CSS, JS, Images etc.). Always verify and double check that what you mean with hits per second or requests per second is indeed what they also mean!

Understanding the “Calculate Throughput based on” variable constant throughput timer

There are several ways the throughput can be calculated and enforced. The default setting is “this thread only“, in my eyes however the most logical setting (based on the above requirements) is the “all active threads” setting.

  • this thread only – each thread, as defined in your Thread Group thread properties, will try to stick to the target throughput. This means that when you have 150 threads, your throughput will be 150 * Target throughput.
  • all active threads in current thread group – the target throughput is divided across the active threads in the thread group. In other words, this will give you the actual target throughput as you have configured. This throughput is for this specific thread group only! Threads themselves are delayed and started based on when this particular thread last ran. e.g.
  • all active threads – When you have more than one thread group, this setting becomes interesting. This will divide the target throughput across all active threads in all Thread Groups. Be aware, each Thread Group requires a Constant Throughput timer with the same settings for this to work.
  • all active threads in current thread group (shared) – Each thread is delayed based on when any thread in the group last ran, meaning the threads run consecutively rather than concurrently. For the rest this setting does exactly the same as the “all active threads in current threadgroup”, e.g. this will give you the actual target throughput as you have configured.
  • all active threads (shared) – Each thread is delayed based on when any thread in the group last ran, meaning the threads run consecutively rather than concurrently. Any thread here has again a wider meaning than in the previous setting, this setting runs across all threads and thread groups you have configured.

How do you know which setting you need?

These different settings can be quite confusing to any Jmeter user, even to experienced users. I would therefore recommend the following:

Make sure you put the constant throughput timer in the root of your testplan (e.g. at the highest level) and let it dictate the throughput of all of your threads and thread groups, e.g. “all active threads“. That way you know for sure what the actual throughput if your test is.

In the case of a somewhat complex environment, where you have several thread groups with each different amounts of requests per second, make sure you set the timer within the root of that particular thread group and stick to the “all threads in current thread group“.

Jmeter Tips & Tricks – Tip 5

Tip 5 – Logging made easy

Generally speaking it is useful to write your logs to file when running tests. This will help reproduce your results later on, make life easy with comparing results of different tests and will serve as a useful audit log for your load report later on.
The easy way to save the log is to add a filename string in the “Write results to file” box of your listener like this:

ViewResultsTreeWriteToFile

As you can see in this example I generally specify the logname to be at least a bit meaningful, e.g. which Listener did I use and how many threads did I start (the latter is not visible in this sample).

You do however quite regularly run the same amount of threads more than once, so how do you make clear which run this was? Updating the filename very quickly becomes an nuisance. So why not automate that?

I generally use the ${__time()} function. Making the filename something like this:
${__time(yyyyMMdd-HHmmss)}-LISTENERNAME-NUMBEROFTHREADS.jtl

ViewResultsInTableWriteToFile

This kind of logging results in a set of files which is easily sortable on filename and easily readable based on the amount of threads started for this particular test:

20160404-103706-resultsInTable-10threads.jtl

Jmeter Tips & Tricks – Tip 2

Tip 2: Semi-random think time from a user

First of all, adding think-time to a Jmeter script can be done with a host different types of timers. The version I am going to propagate here works well for me, I have the feeling I have proper control over the timer this way and I can predict what it does. This does not imply that using a different way of adding think time is wrong in my view. I just happen to like this version.

My think time consists of two pieces: a Test Action with a Uniform Random Timer attached to it:

|__ Test Action > Action: Pause, Current Thread
   |__ Uniform Random Timer > Random Delay Max & Constant Delay Offset set

So, what do the Test Action and the Uniform Random Timer do?

The Test Action sampler is simply a sampler you can use to make a script wait for a specified amount of time.

The Uniform Random Timer however is a bit less simple to explain and understand:

The apache site states the following:

This timer pauses each thread request for a random amount of time, with each time interval having the same probability of occurring. The total delay is the sum of the random value and the offset value.

So what that means is the following.

uniform_random_timer

When setting the Random Delay Maximum, the timer will pick any random value between 0 and 2000. Now add to that the Constant Delay Offset and you have the actual wait (or pause) time JMeter will use in the script in between the requests.


So in this example the value will be somewhere between 1 and 3 seconds.

Disadvantage of this method: You will need to set this think time around every HTTP Request you want to have think time.

The functions as described in this post as well as in the previous Jmeter Tip can be found in this JMX file.